Tuesday, August 9, 2016

Measure of Dispersion

Measures of dispersion measure how spread out a set of data is.


Variance and Standard Deviation

The formulae for the variance and standard deviation are given below. m means the mean of the data.
Variances=S (xr - m)2
    
n
The standard deviation, s, is the square root of the variance.
What the formula means:

(1) xr - m  means take each value in turn and subtract the mean from each value.

(2) (xr - m)2  means square each of the results obtained from step (1). This is to get rid of any minus signs.

(3)  S(xr - m)2  means add up all of the results obtained from step (2).

(4) Divide step (3) by n, which is the number of numbers.

(5) For the standard deviation, square root the answer to step (4).


Example
Find the variance and standard deviation of the following numbers: 1, 3, 5, 5, 6, 7, 9, 10.

The mean = 46/ 8 = 5.75

(Step 1): (1 - 5.75), (3 - 5.75), (5 - 5.75), (5 - 5.75), (6 - 5.75), (7 - 5.75), (9 - 5.75), (10 - 5.75)

= -4.75, -2.75, -0.75, -0.75, 0.25, 1.25, 3.25, 4.25


(Step 2): 22.563, 7.563, 0.563, 0.563, 0.063, 1.563, 10.563, 18.063

(Step 3): 22.563 + 7.563 + 0.563 + 0.563 + 0.063 + 1.563 + 10.563 + 18.063

= 61.504


(Step 4): n = 8, therefore variance = 61.504/ 8 = 7.69 (3sf)

(Step 5): standard deviation = 2.77 (3sf)

Adding or Multiplying Data by a Constant

If a constant, k, is added to each number in a set of data, the mean will be increased by k and the standard deviation will be unaltered (since the spread of the data will be unchanged).
If the data is multiplied by the constant k, the mean and standard deviation will both be multiplied by k.

Grouped Data

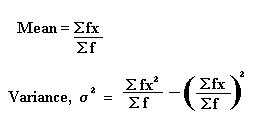
There are many ways of writing the formula for the standard deviation. The one above is for a basic list of numbers. The formula for the variance when the data is grouped is as follows. The standard deviation can be found by taking the square root of this value.

Example

The table shows marks (out of 10) obtained by 20 people in a test
Mark (x)Frequency (f)
10
21
31
43
52
65
75
82
90
101

Work out the variance of this data.

In such questions, it is often easiest to set your working out in a table:

fx   fx2
00
24
39
1248
1050
30180
35245
16128
0       0
10100

Sf = 20

Sfx = 118

Sfx2 = 764


variance =  Sfx2  - ( Sfx )2

                    Sf      (  Sf  )2
 
=  764  -  (118)2
    20       ( 20 )2


 =  38.2 - 34.81 = 3.39


Quartiles

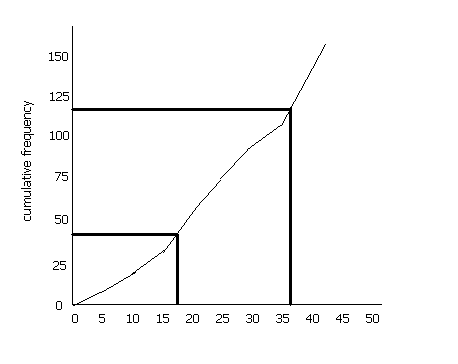
If we divide a cumulative frequency curve into quarters, the value at the lower quarter is referred to as the lower quartile, the value at the middle gives the median and the value at the upper quarter is the upper quartile.

A set of numbers may be as follows: 8, 14, 15, 16, 17, 18, 19, 50. The mean of these numbers is 19.625 . However, the extremes in this set (8 and 50) distort the range. The inter-quartile range is a method of measuring the spread of the numbers by finding the middle 50% of the values.

It is useful since it ignore the extreme values. It is a method of measuring the spread of the data.

The lower quartile is (n+1)/4 th value (n is the cumulative frequency, i.e. 157 in this case) and the upper quartile is the 3(n+1)/4 the value. The difference between these two is the inter-quartile range (IQR).

In the above example, the upper quartile is the 118.5th value and the lower quartile is the 39.5th value. If we draw a cumulative frequency curve, we see that the lower quartile, therefore, is about 17 and the upper quartile is about 37. Therefore the IQR is 20 (bear in mind that this is a rough sketch- if you plot the values on graph paper you will get a more accurate value).
Quartiles

Monday, August 8, 2016

Measures of central tendency

Measures of central tendency are the mean, mode, median, and standard deviation of a set of data.

The three important measures of central tendency are
  1. The Mean
  2. The Median
  3. The Mode

Measures of Central Tendency Definition


Measure of central tendency can be the term which defines the centre of data. There are three parameters by which we can measure central tendency - Mean, median and mode.

Central Tendency of Data


Mean:

Mean of data is a set of numerical values is the arithmetic average of the data values in the set. It is found by adding all the values in the data set and dividing the sum by the total number of values in the set.

Mean of a data set = 


Sum of the Data Values Total Number of Data Values


Median:

For an ordered data set, median is the value in the middle of the data distribution. If there are even number of data values in the set, then there will be two middle values and the median is the average of these two middle values.

Mode 
Mode is the most frequently occurring value in the data set.

In addition to these three important measures of central tendency, another measure is also defined.

Midrange:

Midrange is an estimated measure of the average. It is the average of the lowest and highest values in the data set.

Midrange = 


Lowest Value + Highest Value2

Midrange is only a rough estimate of the central value. As it uses only the lowest and highest values of the data set, it is highly affected when one of them is very high or very low.

Central Tendency Definition

The term central tendency refers to the middle value of the data, and is measured using the mean, median, or mode. It is the tendency of the values of a random variable to cluster around the mean, median, and mode. And a measure of central tendency for a data distribution is a measure of centralness of data and it is used to summarize the data set.

The mean of a sample data is denoted by 


x¯ and the population mean by μ. The mean of a small number of data set can be found by adding all the data values and dividing the sum by total number of values.

Characteristics of Mean

  1. Mean is computed using all the values in the data set.
  2. Mean varies less for samples taken from the same population when compared to the median or mode.
  3. The Mean is unique for a data set. The mean may not be one of the data values in the distribution.
  4. Other statistics such as variance are computed using mean.
  5. Mean is affected the most by the outliers present in the data set. Hence mean is not to be used for data sets containing outliers.


Mean for the grouped data is also computed applying above methods, the mid point of the class is used as x.

Solved Examples

Question 1: The following data set is the worth(in billions of dollars) of 10 hypothetical wealthy men.  Find the mean worth of these top 10 rich men.
12.6, 13.7, 18.0, 18.0, 18.0, 20.0, 20.0, 41.2, 48.0, 60.0

Solution:

Given data,
12.6, 13.7, 18.0, 18.0, 18.0, 20.0, 20.0, 41.2, 48.0, 60.0

Mean of the data set,

x¯ = 

12.6+13.7+18+18+18+20+20+41.2+48+6010


= 296.510

26.95


Question 2: Compute the mean for the distribution given below

Value
   x
Frequency
      f
 20      2
 29      4
 30      4
 39      3
 44      2

Solution:

The frequency table is redone adding one more column f * x

Value
   x
 Frequency
        f
         f * x 
 20        2         40
 29        4        116 
 30        4        120
 39        3        117 
 44        2         88
f = 15fx = 481 

Mean of the distribution x¯=fxf

48115 


32.1 (Answer rounded to the tenth).

Media
When we say the median value of earnings of Actuarial experts is 60,000 dollars, we mean that 50% of these experts earn less than 60,000 dollars and 50% earn more than this. Thus median is the balancing point in an ordered data set. As median represents the 50% mark in a distribution, this is a measure of position as well. Median is much more easier to find than computing the mean.

Uses of Median

  1. Median is used if the analysis requires the middle value of the distribution.
  2. Median is used to determine whether the given data value/s fall in the upper or lower half of the distribution.
  3. Medan can be used even if the classes in the frequency distribution are open ended.
  4. Median is generally used as the central value, when the data is likely to contain outliers.

Solved Examples

Question 1: The number of rooms in 11 hotels in a city is as follows:   
380, 220, 555, 678, 756, 823, 432, 367, 546, 402, 347.
Solution:

The data is first arranged starting from the lowest as follows:
220, 347, 367, 380, 402, 432, 546, 555, 678, 756, 823.

As the number of data elements 11 is an odd number, there is only one middle value in the data array, which is the 6th.

=> The value of data in 6th position = 432.

Hence the mean number of Hotel rooms in the city = 432.

Question 2: Find the median of the given data

 Value
     X
 Frequency
       f
 20       2
 29       4
 30       4
 39       3
 44       2

Solution:


Value
   x
   Frequency
        f
   Cumulative
    frequency
 20        2         2
 29        4 2 + 4 =  6 
 30        4 6 + 4 = 10
 39        310 + 3 = 13 
 44         213 + 2 = 15
f = 15fx = 481 

=> f = 15 items,
The 8th item in the ordered data array will be the median. The 8 item will be included in the cumulative frequency 10. Hence the median of the distribution is the x value corresponding to cumulative frequency 10 which reads as 30.

=> Median of the data = 30.


Mode


Mode is the value or category that occurs most in a data set.
  • If all the elements in the data set have the same frequency of occurrence, then distribution does not have a mode.
  • In a unimodal distribution, one value occurs most frequently in comparison to other values.
  • A bimodal distribution has two elements have the highest frequency of occurrence.

Characteristics of Mode:
  1. Mode is the easiest average to determine and it is used when the most typical value is required as the central value. 
  2. Mode can be found for nominal data set as well.
  3. Mode need not be a unique measure. A distribution can have more than one mode or no mode at all.

Solved Example

Question: Find the mode of a numerical data set

109  112  109  110  109  107  104  104  104  111  111  109  109  104  104
Solution:

Given data,
109  112  109  110  109  107  104  104  104  111  111  109  109  104  104

Total number of element = 15

Among the 15 data elements the values 104 and 109 both occur five times which are hence the modes of the data set.


Effect of Transformations on Central Tendency

If all the data values in a data distribution is subjected to some common transformation, what would be the effect of this on the measures of central tendency?
  • If each element in a data set is increased by a constant, the mean, median and mode of the resulting data set can be obtained by adding the same constant to the corresponding values of the original data set.
  • When each element of a data set is multiplied by a constant, then the mean, median and mode of the new data set is obtained by multiplying the corresponding values of the original data set.

Central Tendency and Dispersion

Two kinds of statistics are frequently used to describe data. They are measures of central tendency and dispersion. These are often called descriptive statistics because they can help us to describe our data. 

Measures of Central Tendency and Dispersion 


Mean, median and 
mode are all measures of central tendency whereas range, variance and standard deviation are all measures ofdispersion. The measures used to describe the data set are measures of central tendency and measures of dispersion or variability. 

Central Tendency Dispersion


If different sets of numbers can have the same mean. Then we will study two measures of dispersion, which give you an idea of how much the numbers in a set differ from the mean of the set. These two measures are called the variance of the set and the standard deviation of the set.

Resistant Measures of Central Tendency

A resistant measure is one that is less influenced by extreme data values. The mean is less resistant than the median, that is the mean is more influenced by extreme data values. Resistant measure of central tendency can resist the influence of extreme observations or outliers. 

Let us see the effect of outlier with the help of example:

Solved Example

Question: Consider the data set, 5, 19, 19, 20, 21, 23, 23, 23, 24 , 25.

Solution:

The value 5 is an outlier of the data as it is too less than the other values in the distribution.
Let us calculate the the central values for the data set either by including and excluding 5.

Step 1:
The data set excluding 5  is 19, 19, 20, 21, 23, 23, 23, 24 , 25

Mean = 


x¯=19+19+20+21+23+23+23+24+259=1979 = 21.89

=> Mean = 21.89

Median = 23

Mode = 23

Step 2:
For the data including the outlier  5, 19, 19, 20, 21, 23, 23, 23, 24 , 25


Mean = 


x¯=5+19+19+20+21+23+23+23+24+259=20210 = 20.2

=> Mean = 20.2

Median = 21+232 = 22


Mode = 23

Step 3:
Comparing the values of mean, median and mode found in step 1 and step 2, the mean is most affected and mode is least affected by the inclusion of the outlier value 5.

Central Tendency and Variability

Central tendency is a statistical measure that represents a central entry of a data set. The problem is that there is no single measure that will always produce a central, representative value in every situation. There are three main measures of central tendency, mean, median and mode.

Variability is the important feature of a frequency distribution. Range, variance and standard deviation are all measures of variability. Range, variance and standard deviation are all measures of variability.

Range - The simplest measure of variability is the range, which is the difference between the highest and the lowest scores. 

Standard Deviation - The standard deviation is the average amount by which the scores differ from the mean.

Variance - The variance is another measure of variability. It is just the mean of the squared differences, before we take the square root to get the standard deviation. 

Central Tendency Theorem

A more formal and mathematical statement of the Central Limit Theorem is stated as follows:

Suppose that x1,x2,x3,...................,xn are independent and identically distributed with mean μ and finite variance σ2 . Then the random variable Un is defined as,

Un = X¯μσn


Where, X¯=1ni=1nXi


Then the distribution function of Un converges to the standard normal distribution function as n increases without bound.


Central Tendency Examples

A measure of central tendency is a value that represents a central entry of a data set. Central tendency of the data can be calculated by measuring mean, median and mode of the data.


Below you could see some examples of central tendency:

Solved Examples

Question 1: Find the mean, median and mode of the given data.
10, 12, 34, 34, 45, 23, 42, 36, 34, 22, 20, 27, 33.

Solution:

Given Data,

X = 10, 12, 34, 34, 45, 23, 42, 36, 34, 22, 20, 27, 33.

ΣX = 10 + 12 + 34 + 34 + 45 + 23 + 42 + 36 + 34 + 22 + 20 + 27 + 33

= 372

=> ΣX = 372

Step 1: 
Mean = XX 

37213

[ X = Total number of terms ]

= 28.6

=> Mean = 28.6
Step 2:For Median,

Arrange the data in ascending order.

10, 12, 20, 22, 23, 27, 33, 34, 34, 34, 36, 42, 45.

The median is 33. Half of the values fall above this number and half fall below.

=> Median = 33
Step 3:
Mode

Mode = 34

Because 34 occur maximum times.
 Question 2: The following table shows the sport activities of 2400 students.

SportFrequency 
Swimming  423
Tennis  368
Gymnastics  125
Basket ball   452
Base ball  380
Athletics   275
None  377


Solution:
From the given table:

For grouped data the class with highest frequency is called the Modal class. 
The category with the longest column in the bar graph represents the mode of data set.

Basket ball has the highest frequency of 452. Hence Basket ball is the mode of the sport activities.


Question 3: Find the median of the distribution,
223, 227, 240, 211, 212, 209, 211, 213, 240, 229.
Solution:

The ordered data array will be:     
209, 211, 211, 212, 213, 223, 227, 229, 240, 240

The number of data values is even. Hence the two central values are those in the 5th and the 6th positions.

Median = 212+2232 = 4362 = 218


=> Median = 218.


QUESTION


Question 1
What is the mode of the following numbers?
Question 2
What is the median of the following numbers?
Question 3
What is the arithmetic mean of the following numbers?
8, comma, 10, comma, 8, comma, 5, comma, 4, comma, 7, comma, 5, comma, 10, comma, 8